How this feature connects to others
Builds on
Feature overview
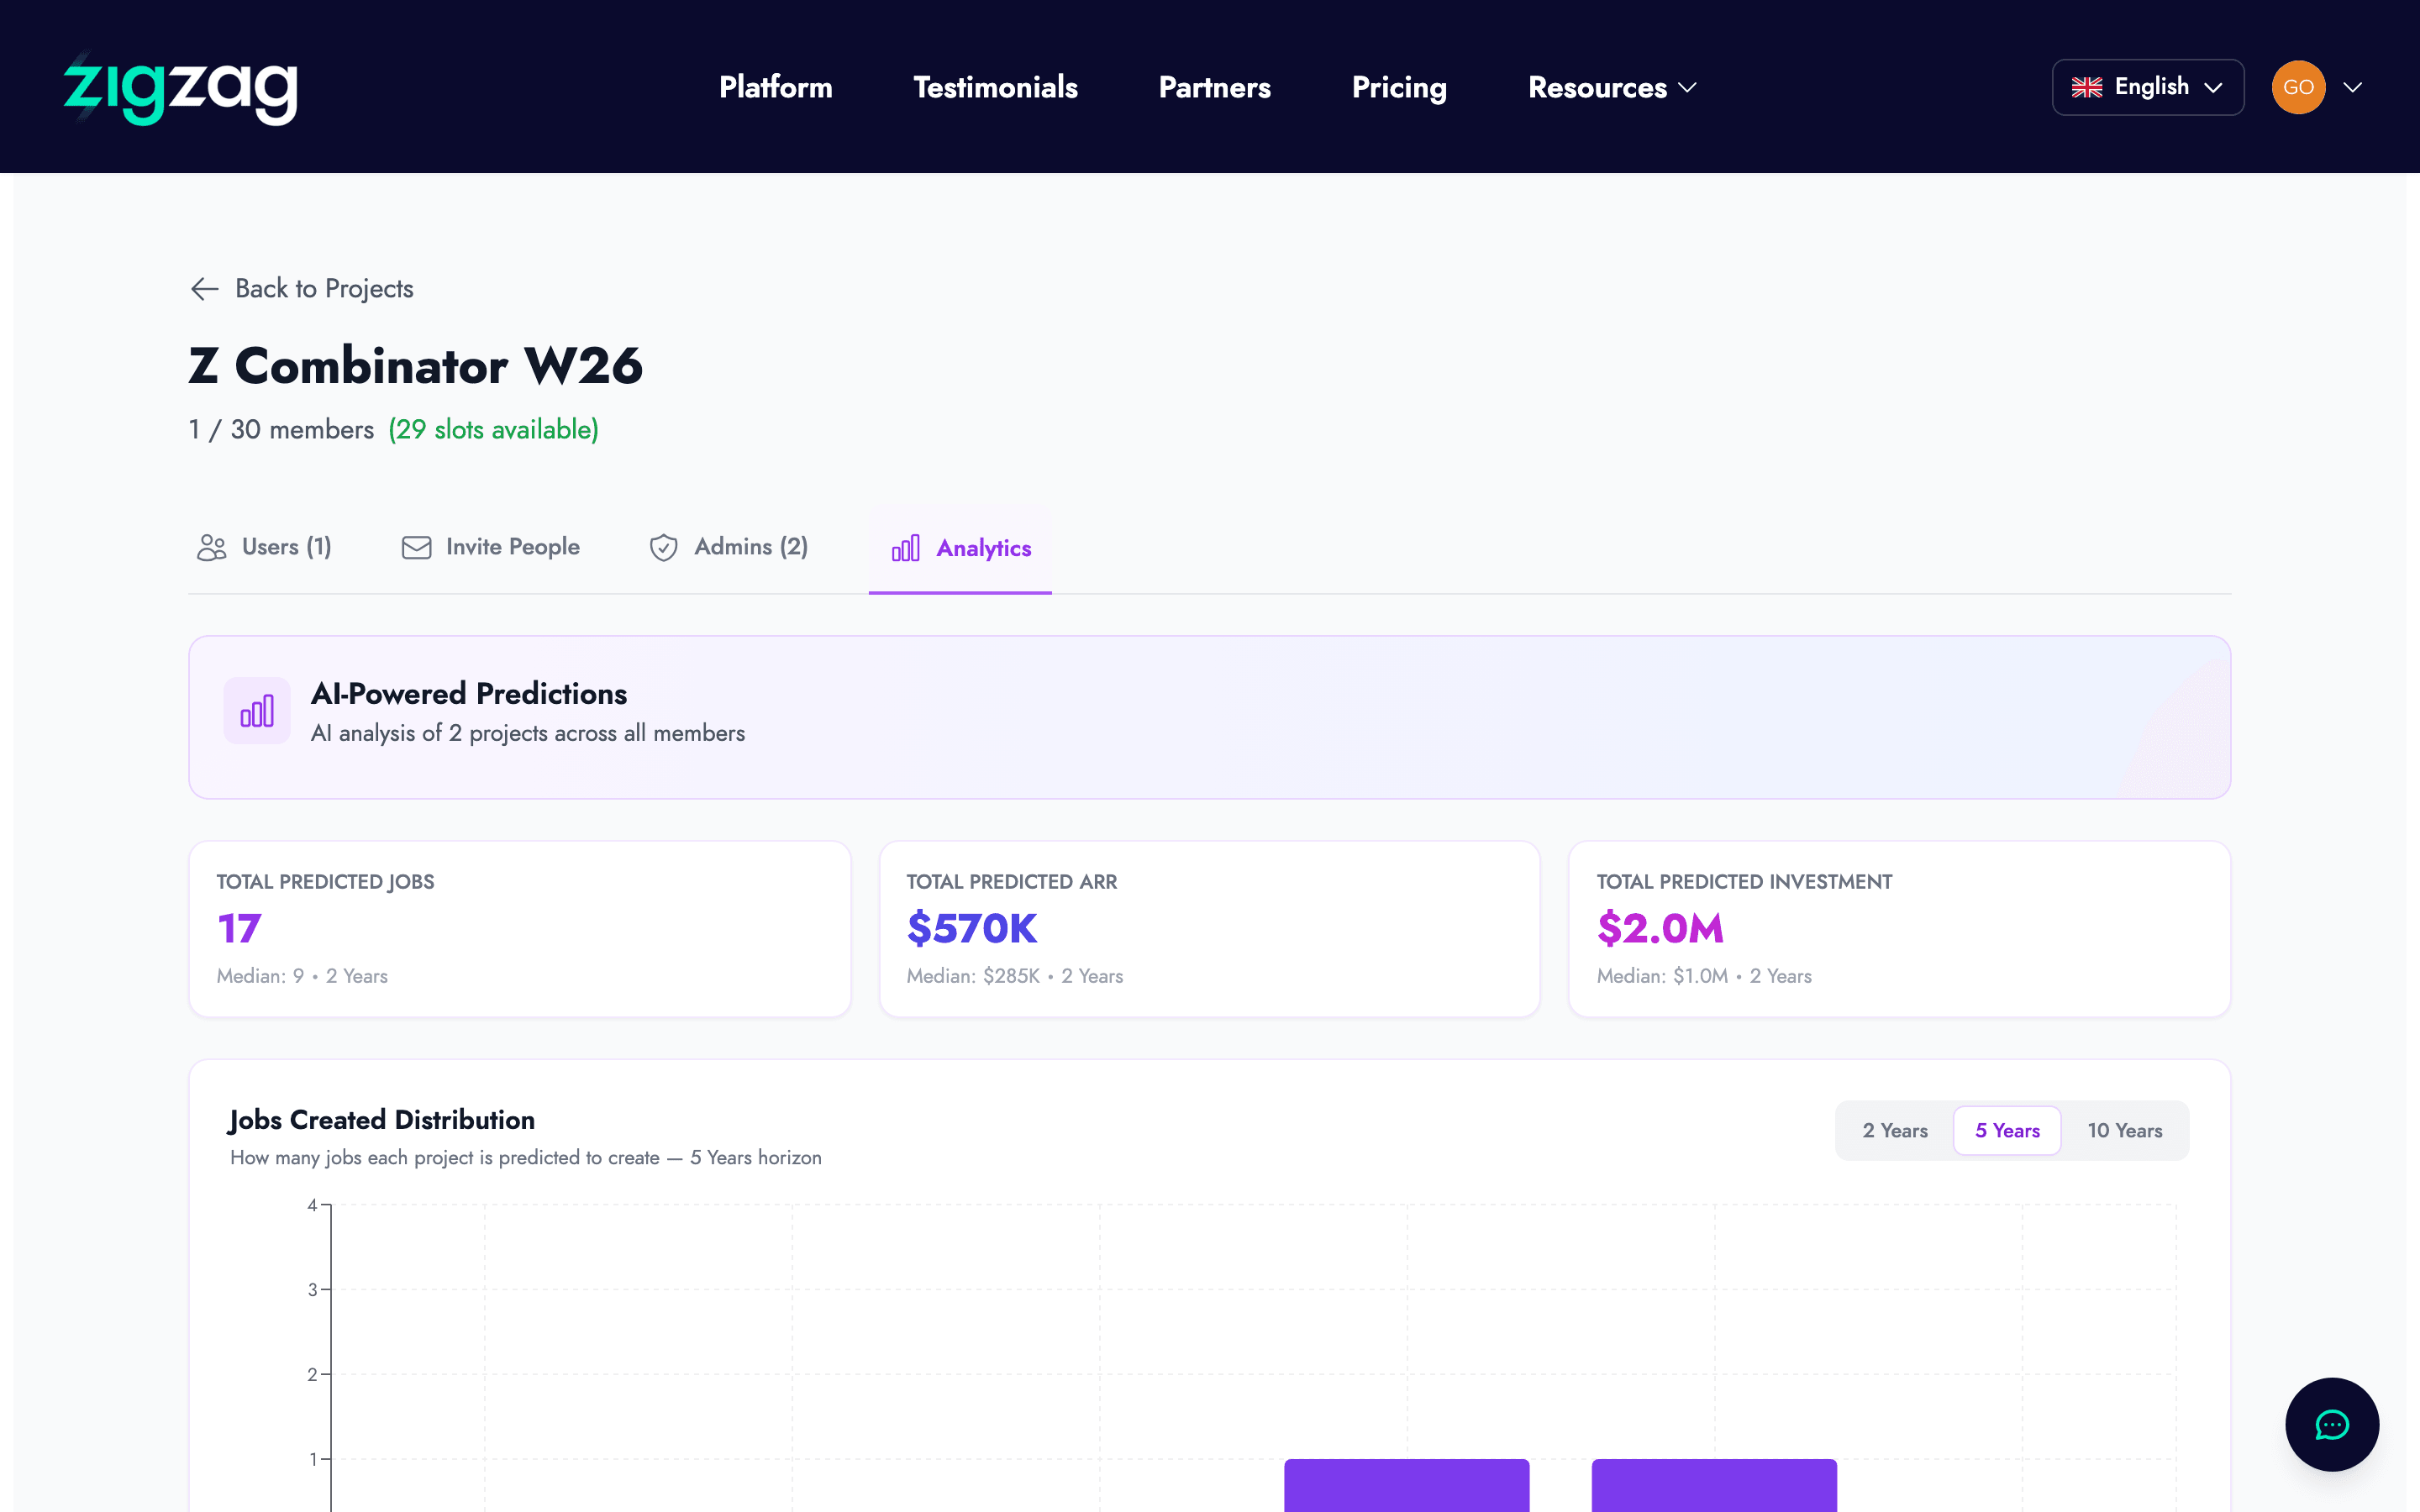
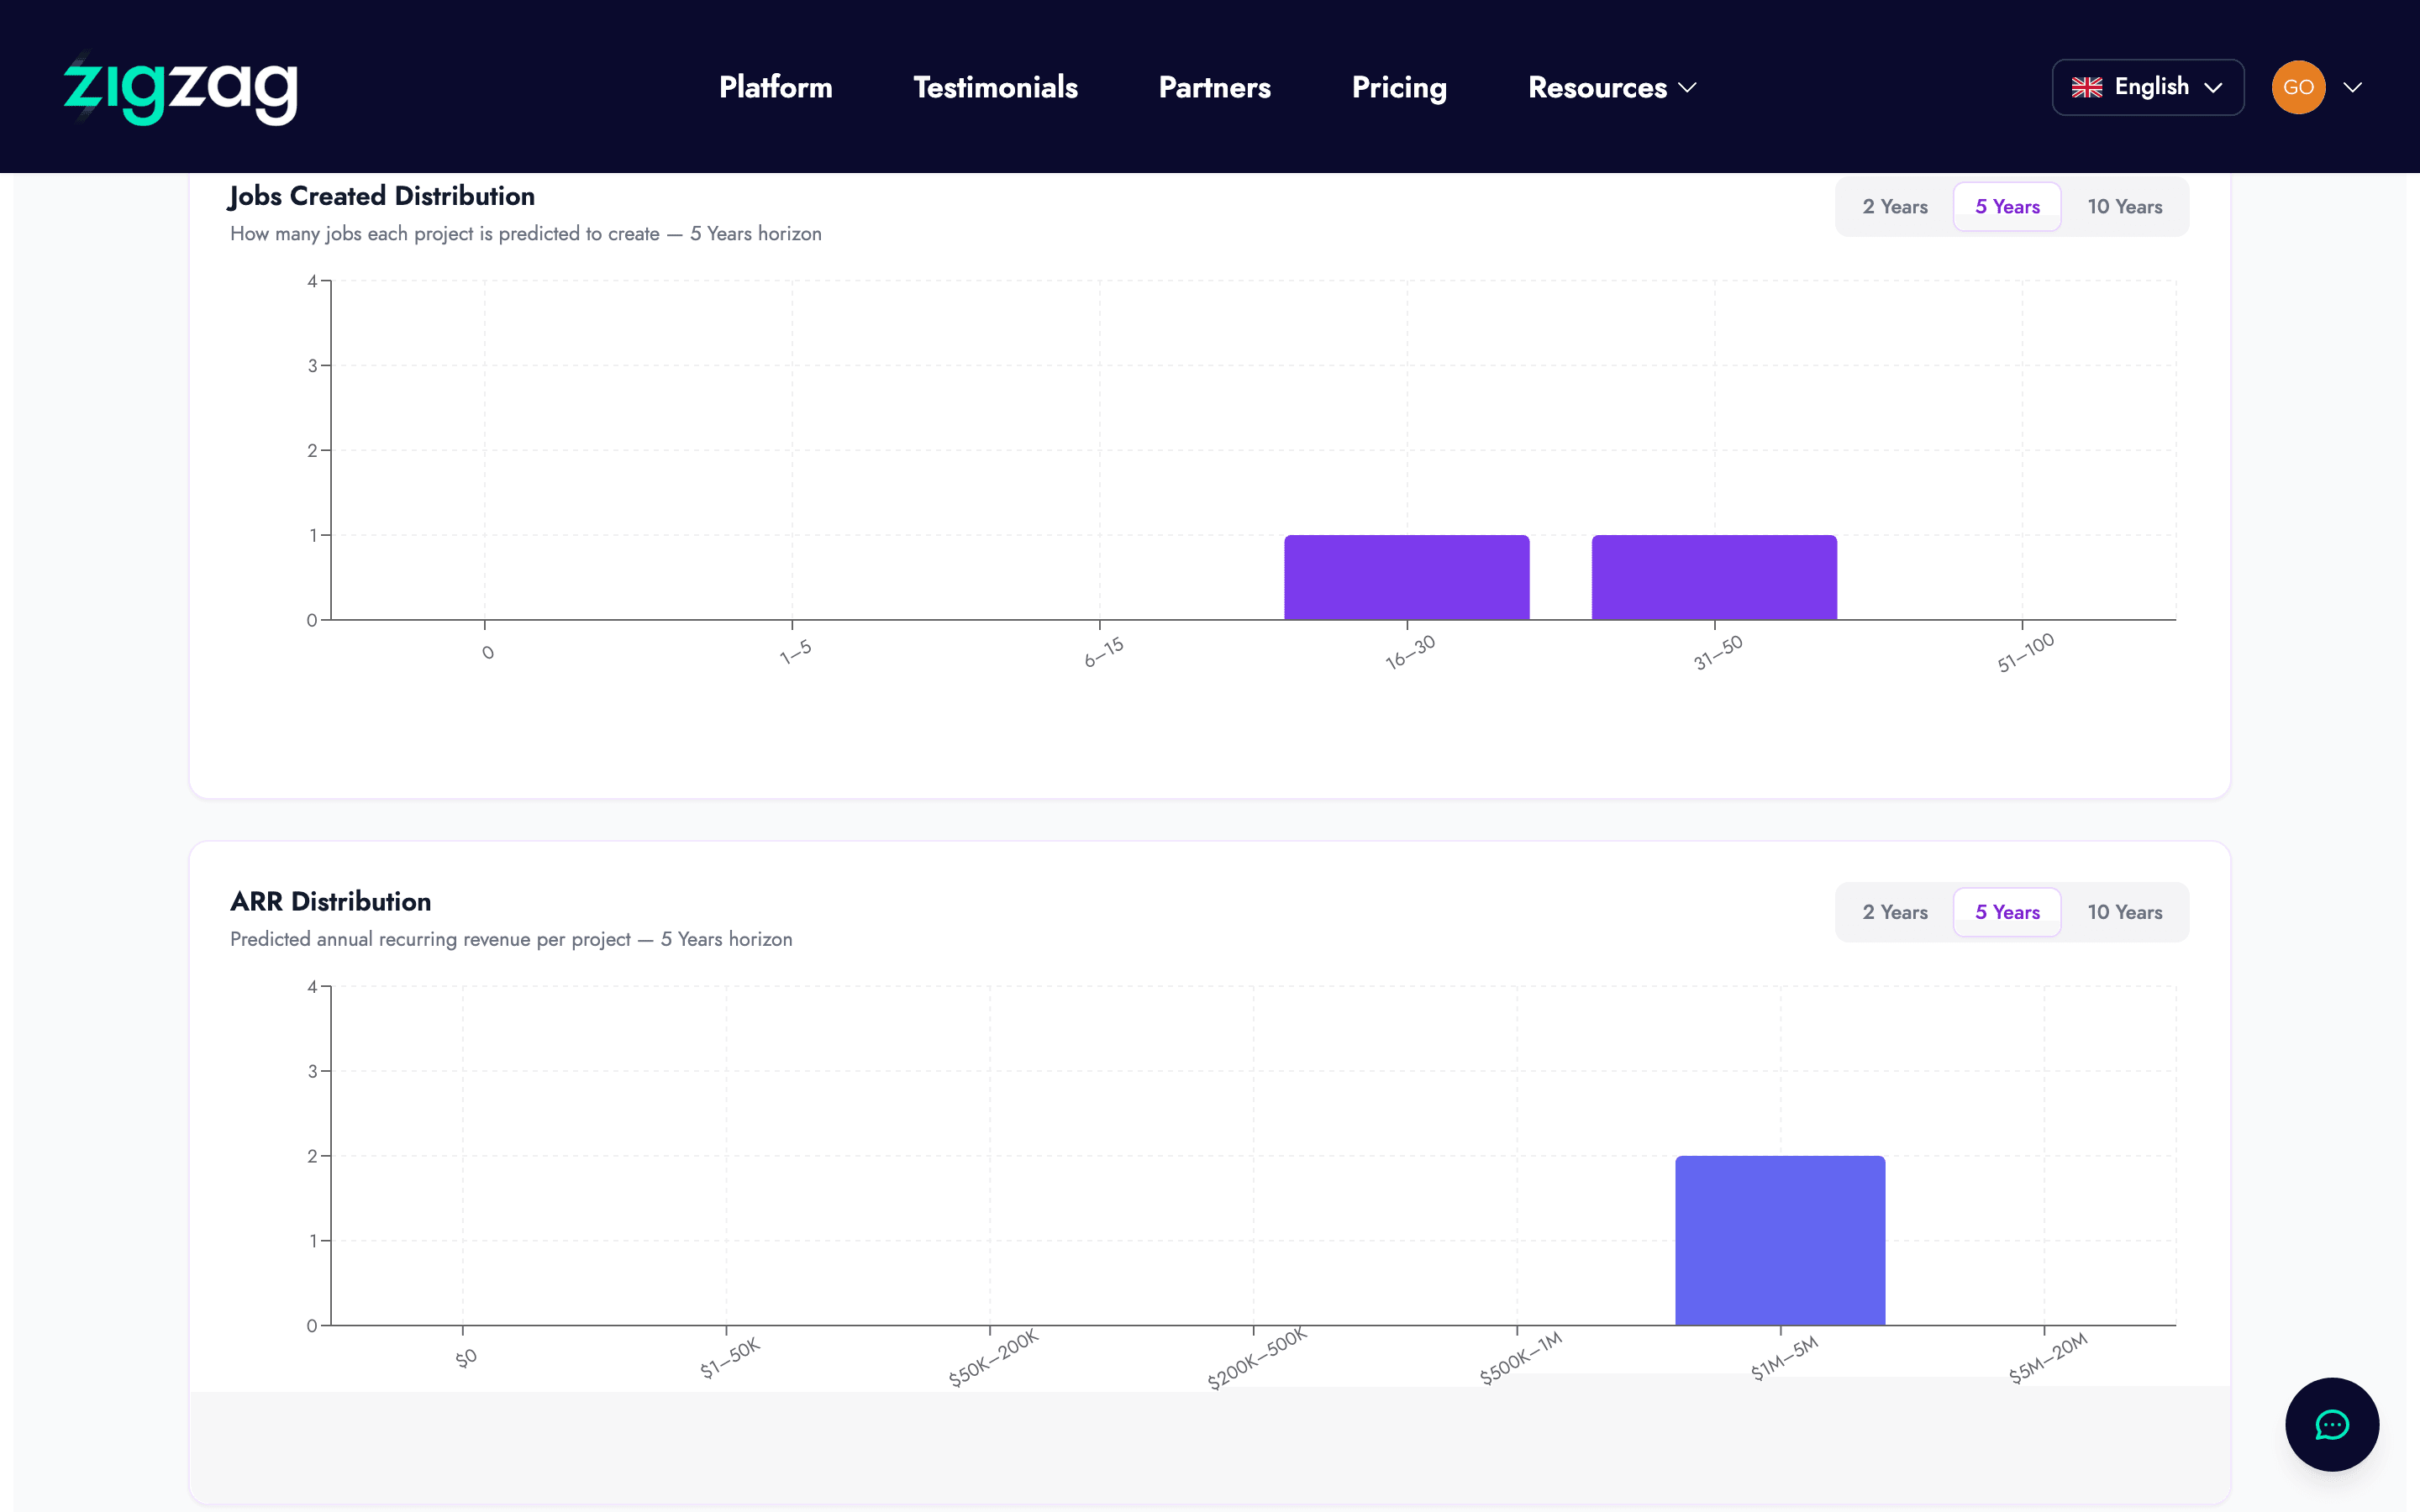
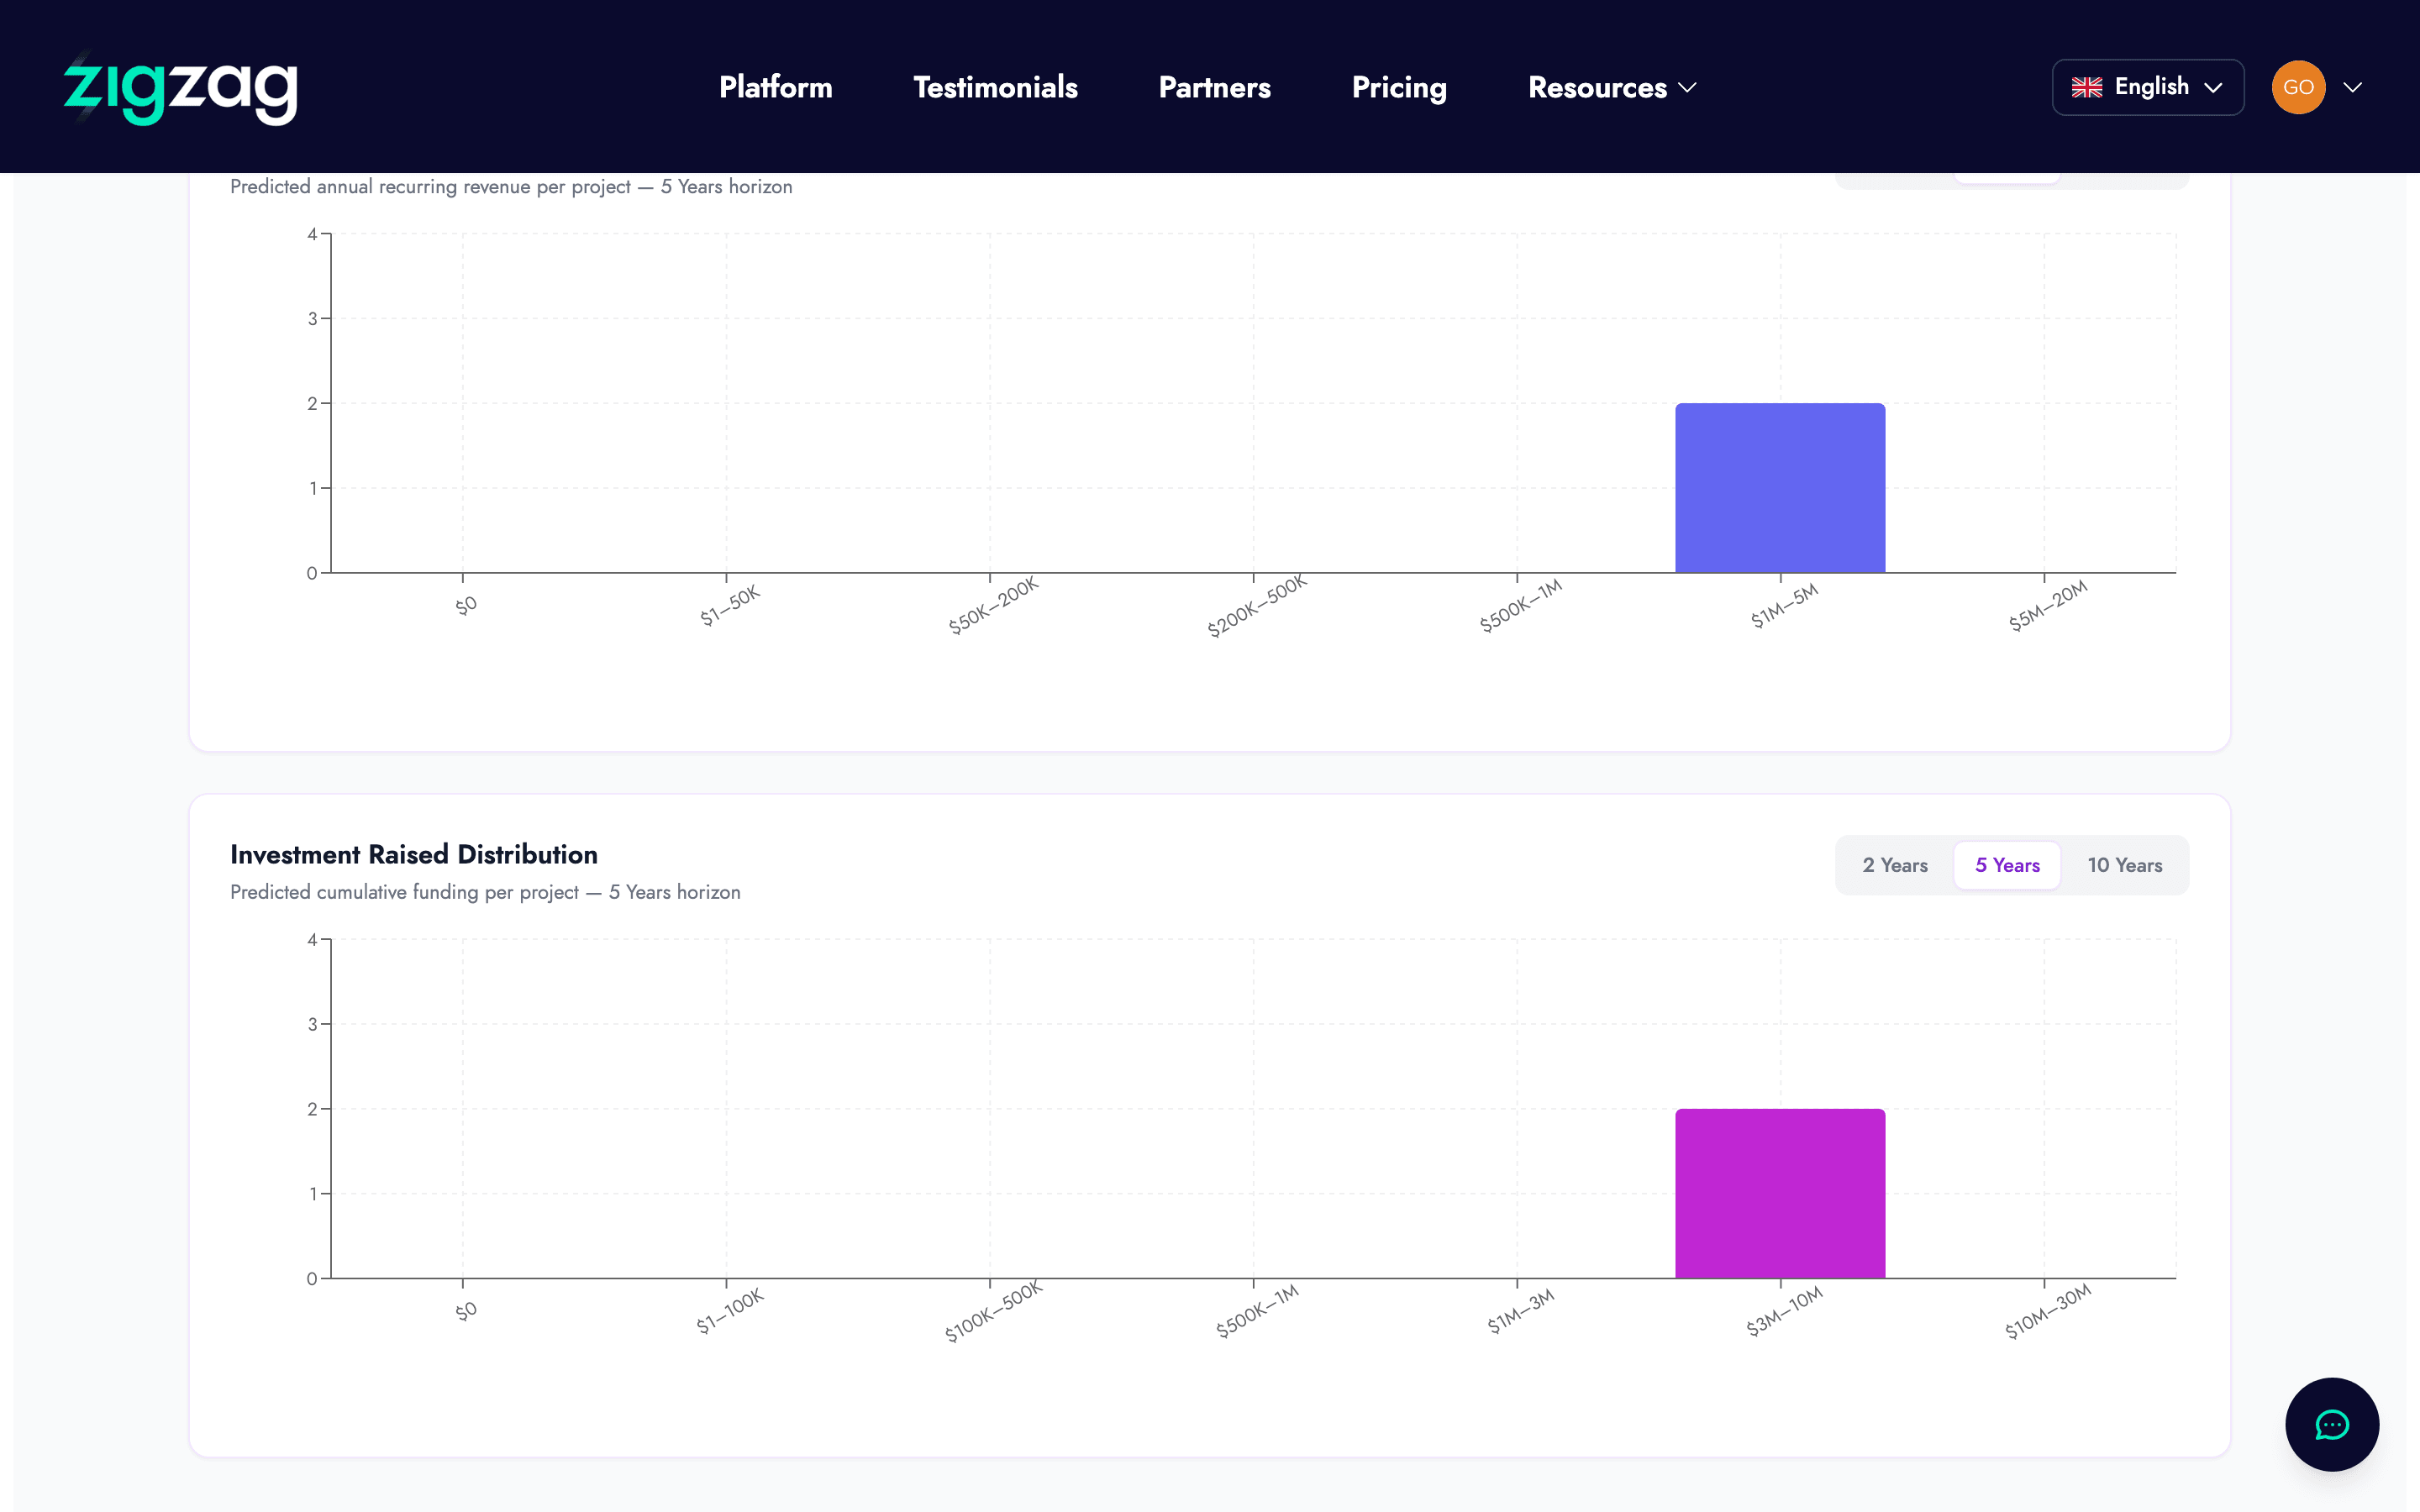
What the Analytics dashboard shows
The Analytics dashboard shows aggregate data about all the projects in your program. You can see how many projects have been created, how many are currently active, and how many have reached specific milestones — completing their Lean Canvas, running their first validation survey, generating a pitch deck, or assembling a full investor data room.
It also provides drill-down views at the individual project level, so you can examine any specific startup's history of activity within the platform.
Why program-level analytics matter
Running a startup accelerator or innovation program involves tracking a large amount of information about a large number of teams simultaneously. Without a structured way to view this, it is easy to focus attention on the most vocal teams and inadvertently miss the ones that are quietly struggling or quietly making significant progress.
Analytics helps you see your entire program at a glance and identify where your attention or intervention would be most valuable — before a team falls too far behind to recover within the program timeline.
Using analytics for program reporting
The analytics data can be used directly for program reporting to a range of audiences: funding bodies, corporate program sponsors, institutional partners, or your own leadership team. Metrics like "the percentage of cohort teams that have completed customer validation" or "the average number of documents in investor data rooms across active projects" give stakeholders a clear, quantitative picture of program outcomes.
This kind of structured reporting is increasingly expected by program funders. Having it available from a single dashboard reduces the reporting burden on program managers significantly.
How data flows into the analytics dashboard
The Analytics dashboard draws its data automatically from the Admin Projects feature. Every action a startup team takes in zigzag — completing a Lean Canvas, running a survey, generating a pitch deck, assembling a data room — is recorded and reflected in the analytics in real time.
There is no manual data entry required. The system captures progress as it happens, which means the dashboard always reflects the current state of your program without requiring program managers to chase updates from individual teams.
How this connects to Admin Projects
Analytics and Admin Projects work as a pair. Admin Projects gives you the individual view: what is each startup doing, what have they completed, what do they need? Analytics gives you the aggregate view: how is the program performing as a whole?
Together, they give program managers the same kind of visibility into their cohort's progress that individual founders get from zigzag's own progress-tracking for their startup. The goal is to make program management based on evidence rather than impression.